Chapter Overview:
Human beings are producers and consumers of Earth's resources. In this chapter, we will discuss the size,
distribution, growth, and characteristics of India's population. Population is the pivotal element in
social studies as it is the point of reference from which all other elements are observed.
1. Introduction
- Census: An official enumeration of population done periodically. In India, the
first census was held in 1872, but the first complete census was taken in
1881. It is held every 10 years.
- Why Population Matters? It is the people who make resources and use them to develop
the country. We are interested in knowing how many people are there, where they live, how they are
growing, and their characteristics.
2. Population Size and Distribution
(i) Population Size (Numbers)
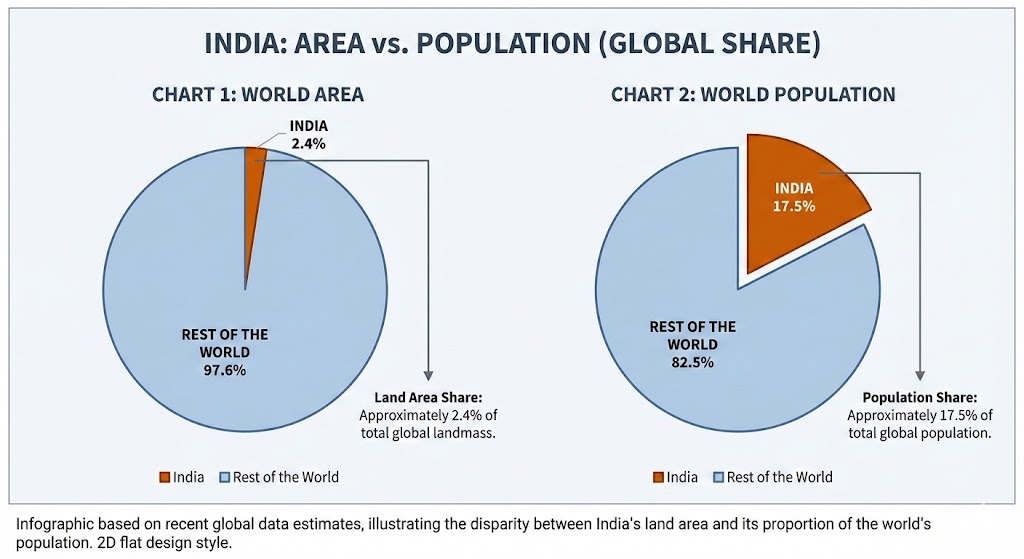
- India's Population (2011): 1,210.6 million (17.5%
of world population).
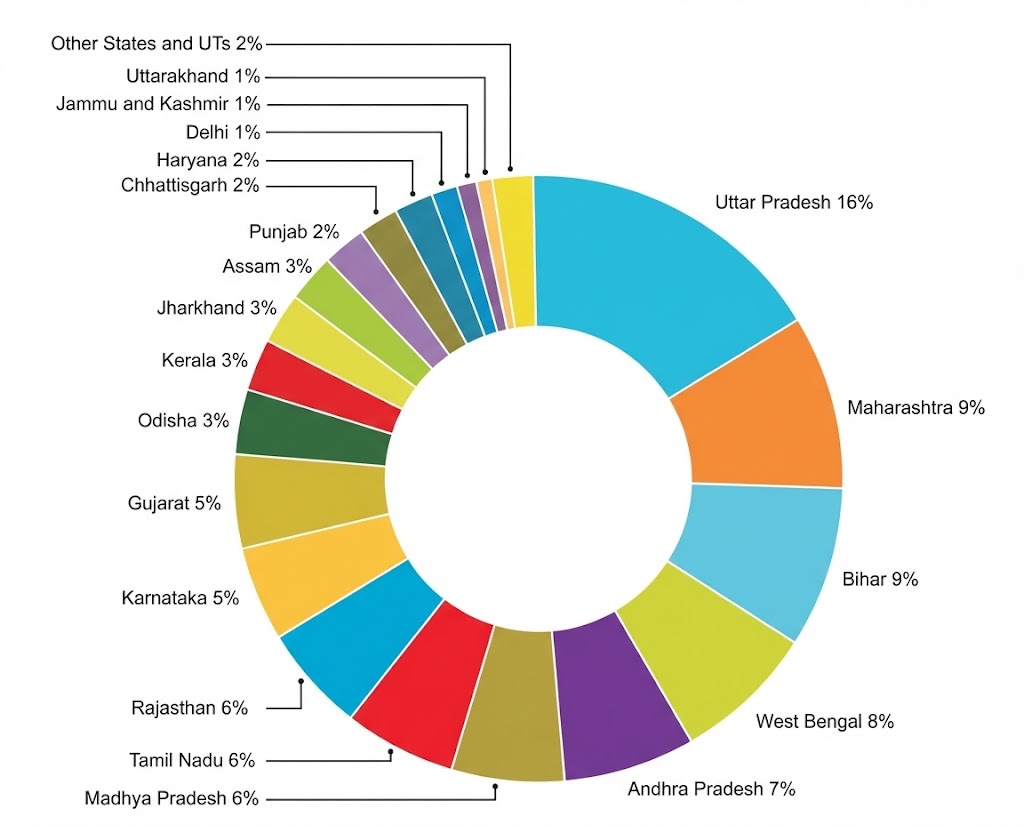
- Most Populous State: Uttar Pradesh (199 million) - accounts for 16% of the country's
population.
- Least Populous: Sikkim (0.6 million).
- Union Territory: Lakshadweep has only 64,429 people.
- Concentration: Almost half of India's population lives in just five states: UP,
Maharashtra, Bihar, West Bengal, and Andhra Pradesh.
- Land Area: Rajasthan is the biggest state in terms of area.
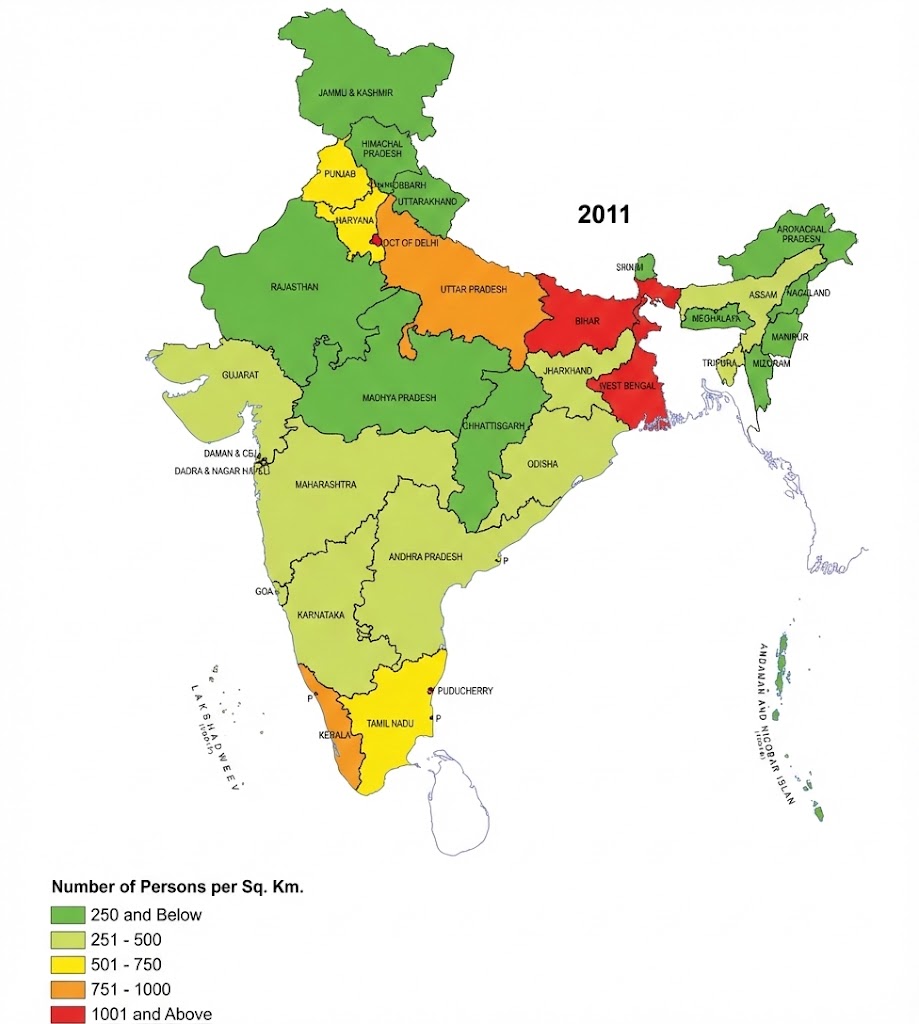
(ii) Population Density
Population density = Number of persons per unit area.
- India's Average Density (2011): 382 persons per sq
km.
- Highest Density: Bihar (1,102 persons/sq km).
- Lowest Density: Arunachal Pradesh (17 persons/sq
km).
- High Density Areas: Northern Plains and Kerala (flat plains, fertile soil, abundant
rainfall).
- Low Density Areas: Rugged terrain and unfavorable climatic conditions (e.g., Mountains,
Deserts).
3. Population Growth and Processes of Change
Population Growth: Change in the number of inhabitants of a country/territory during a
specific period of time (e.g., last 10 years).
- Absolute Increase: (Pop. in 2011) - (Pop. in 2001).
- Annual Growth Rate: The rate at which population increases per year (e.g., 1.64%
per annum).
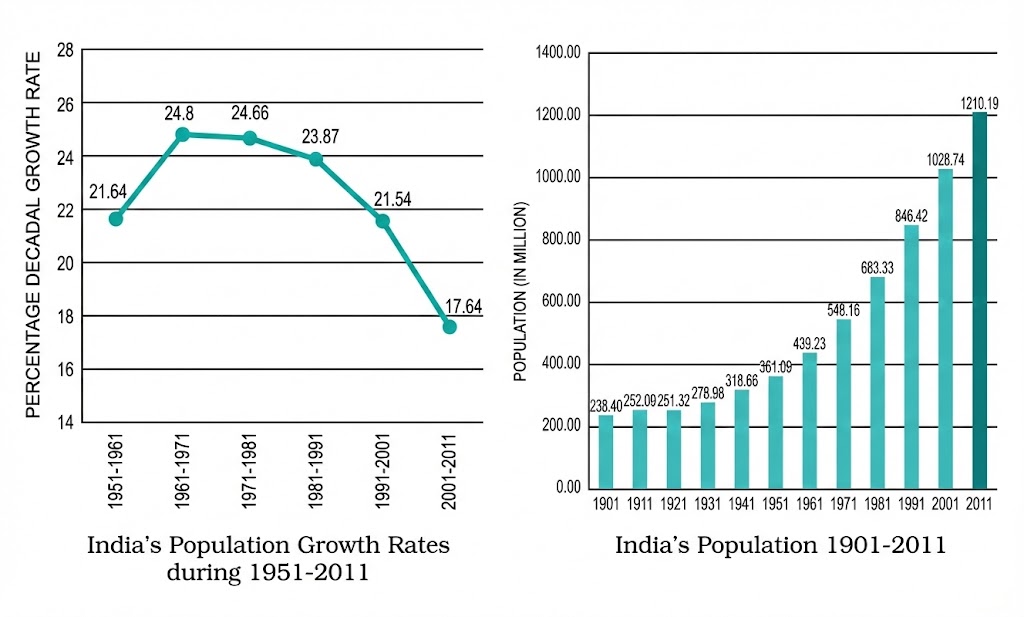
Trend: India's population has been steadily increasing from 361 million in 1951 to 1210
million in 2011. Since 1981, the growth rate started declining, but absolute numbers are still
high.
Processes of Population Change
Population changes due to three processes: Births, Deaths, and Migrations.
- Birth Rate: Number of live births per 1000 persons in a year. (Major cause of growth in
India).
- Death Rate: Number of deaths per 1000 persons in a year. (Rapid decline in death rate
is the main cause of rapid growth).
- Migration: Movement of people across regions/territories.
- Internal Migration: Within the country (Does not change population size, but changes
distribution).
- International Migration: Between countries (Changes size and distribution).
- Trend: Rural-to-Urban migration due to Push factors
(poverty/unemployment in rural areas) and Pull factors (jobs/better living in
cities).
4. Characteristics of the Population
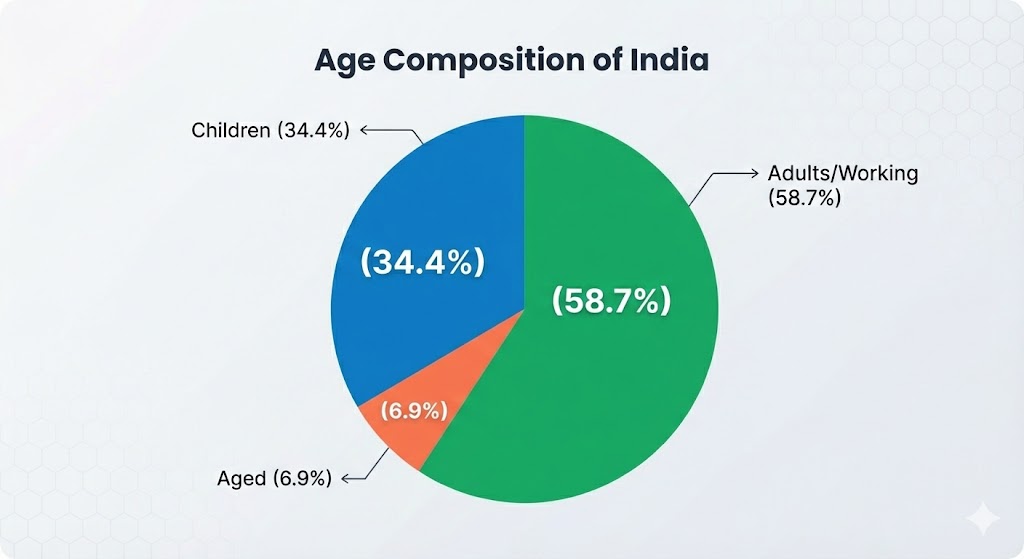
(i) Age Composition
- 1. Children (below 15 years): Generally unproductive. Need food, clothing, education,
medical care. (34.4%)
- 2. Working Age (15-59 years): Economically productive and biologically reproductive.
They comprise the working population. (58.7%)
- 3. Aged (Above 59 years): Can be economically productive but generally retired. (6.9%)
(ii) Sex Ratio
- Definition: Number of females per 1000 males in the population.
- India (2011): 940 females per 1000 males.
- Variations:
- Kerala: 1084 (Positive)
- Puducherry: 1037 (Positive)
- Delhi: 866 (Low)
- Haryana: 877 (Low)
(iii) Literacy Rate
- Definition: A person aged 7 years and above, who can read and write with understanding
in any language, is treated as literate.
- India (2011): 73%. (Males: 80.9%, Females: 64.6%).
(iv) Occupational Structure
Distribution of population according to different types of occupation.
- Primary Activities: Agriculture, animal husbandry, forestry, fishing, mining. (64% of
India's population is still dependent on agriculture).
- Secondary Activities: Manufacturing, building, construction work. (13%).
- Tertiary Activities: Transport, communications, commerce, administration, services.
(20%).
(v) Health
- Significant improvement in health status.
- Death Rate: Declined from 25 (in 1951) to 7.2 (in 2011).
- Life Expectancy: Increased from 36.7 years (in 1951) to 67.9 years (in 2012).
5. Adolescent Population
Adolescents constitute one-fifth of the total population of India. They are usually
grouped in the age group of 10 to 19 years.
Challenge: Their nutritional requirements are higher. Poor nutrition can lead to
deficiency and stunted growth. Anemia affects many adolescent girls.
6. National Population Policy (NPP 2000)
Govt of India initiated a comprehensive Family Planning Programme in 1952. The NPP 2000 provides a policy
framework for:
- Free and compulsory school education up to 14 years of age.
- Reducing Infant Mortality Rate (IMR) to below 30 per 1000 live births.
- Achieving universal immunization of children.
- Promoting delayed marriage for girls.
- Making family welfare a people-centered programme.
Q1: Which state has the highest population density?
Ans: Bihar (1102 persons/sq km).
Q2: What is the sex ratio of India as per 2011 census?
Ans: 940 females per 1000 males.